A benefit of studying mathematics is that you learn how to describe things and their relationships. For example, if you want to describe a line, you can with the equation y = mx + b, where b is the y-intercept and m is the slope.
I know what you’re thinking, that’s cool but other than passing an elementary school math test, how does knowing something like that help you? It turns out that knowing how to describe a line carries over to things that resemble a line. Like startups.
An obvious but overlooked difference between founders and investors is, founders are concerned with how to make their startup successful, investors are concerned with how to tell if someone else’s startup will be successful. Having spent most of my time as the former but now the latter, I find that thinking of each startup as a line is a helpful mental model for assessing whether they will be successful. The first time we meet with a startup is x = 0, think of x as representing time, and their traction at that time is the y-intercept. The interesting question is what’s their slope? Not an easy question to answer. The entire venture capital industry is dedicated to answering this one question.
Before attempting to answer it, let’s talk about why it’s the most important question.
Take the following 2 startups:
- Startup A – 10,000 users at Week 0 (y-intercept) and is adding 100 users every week (slope)
- Startup B – 1,000 users at Week 0 (y-intercept) and is adding 300 users every week (slope)
Plotting the lines for both yields this plot.
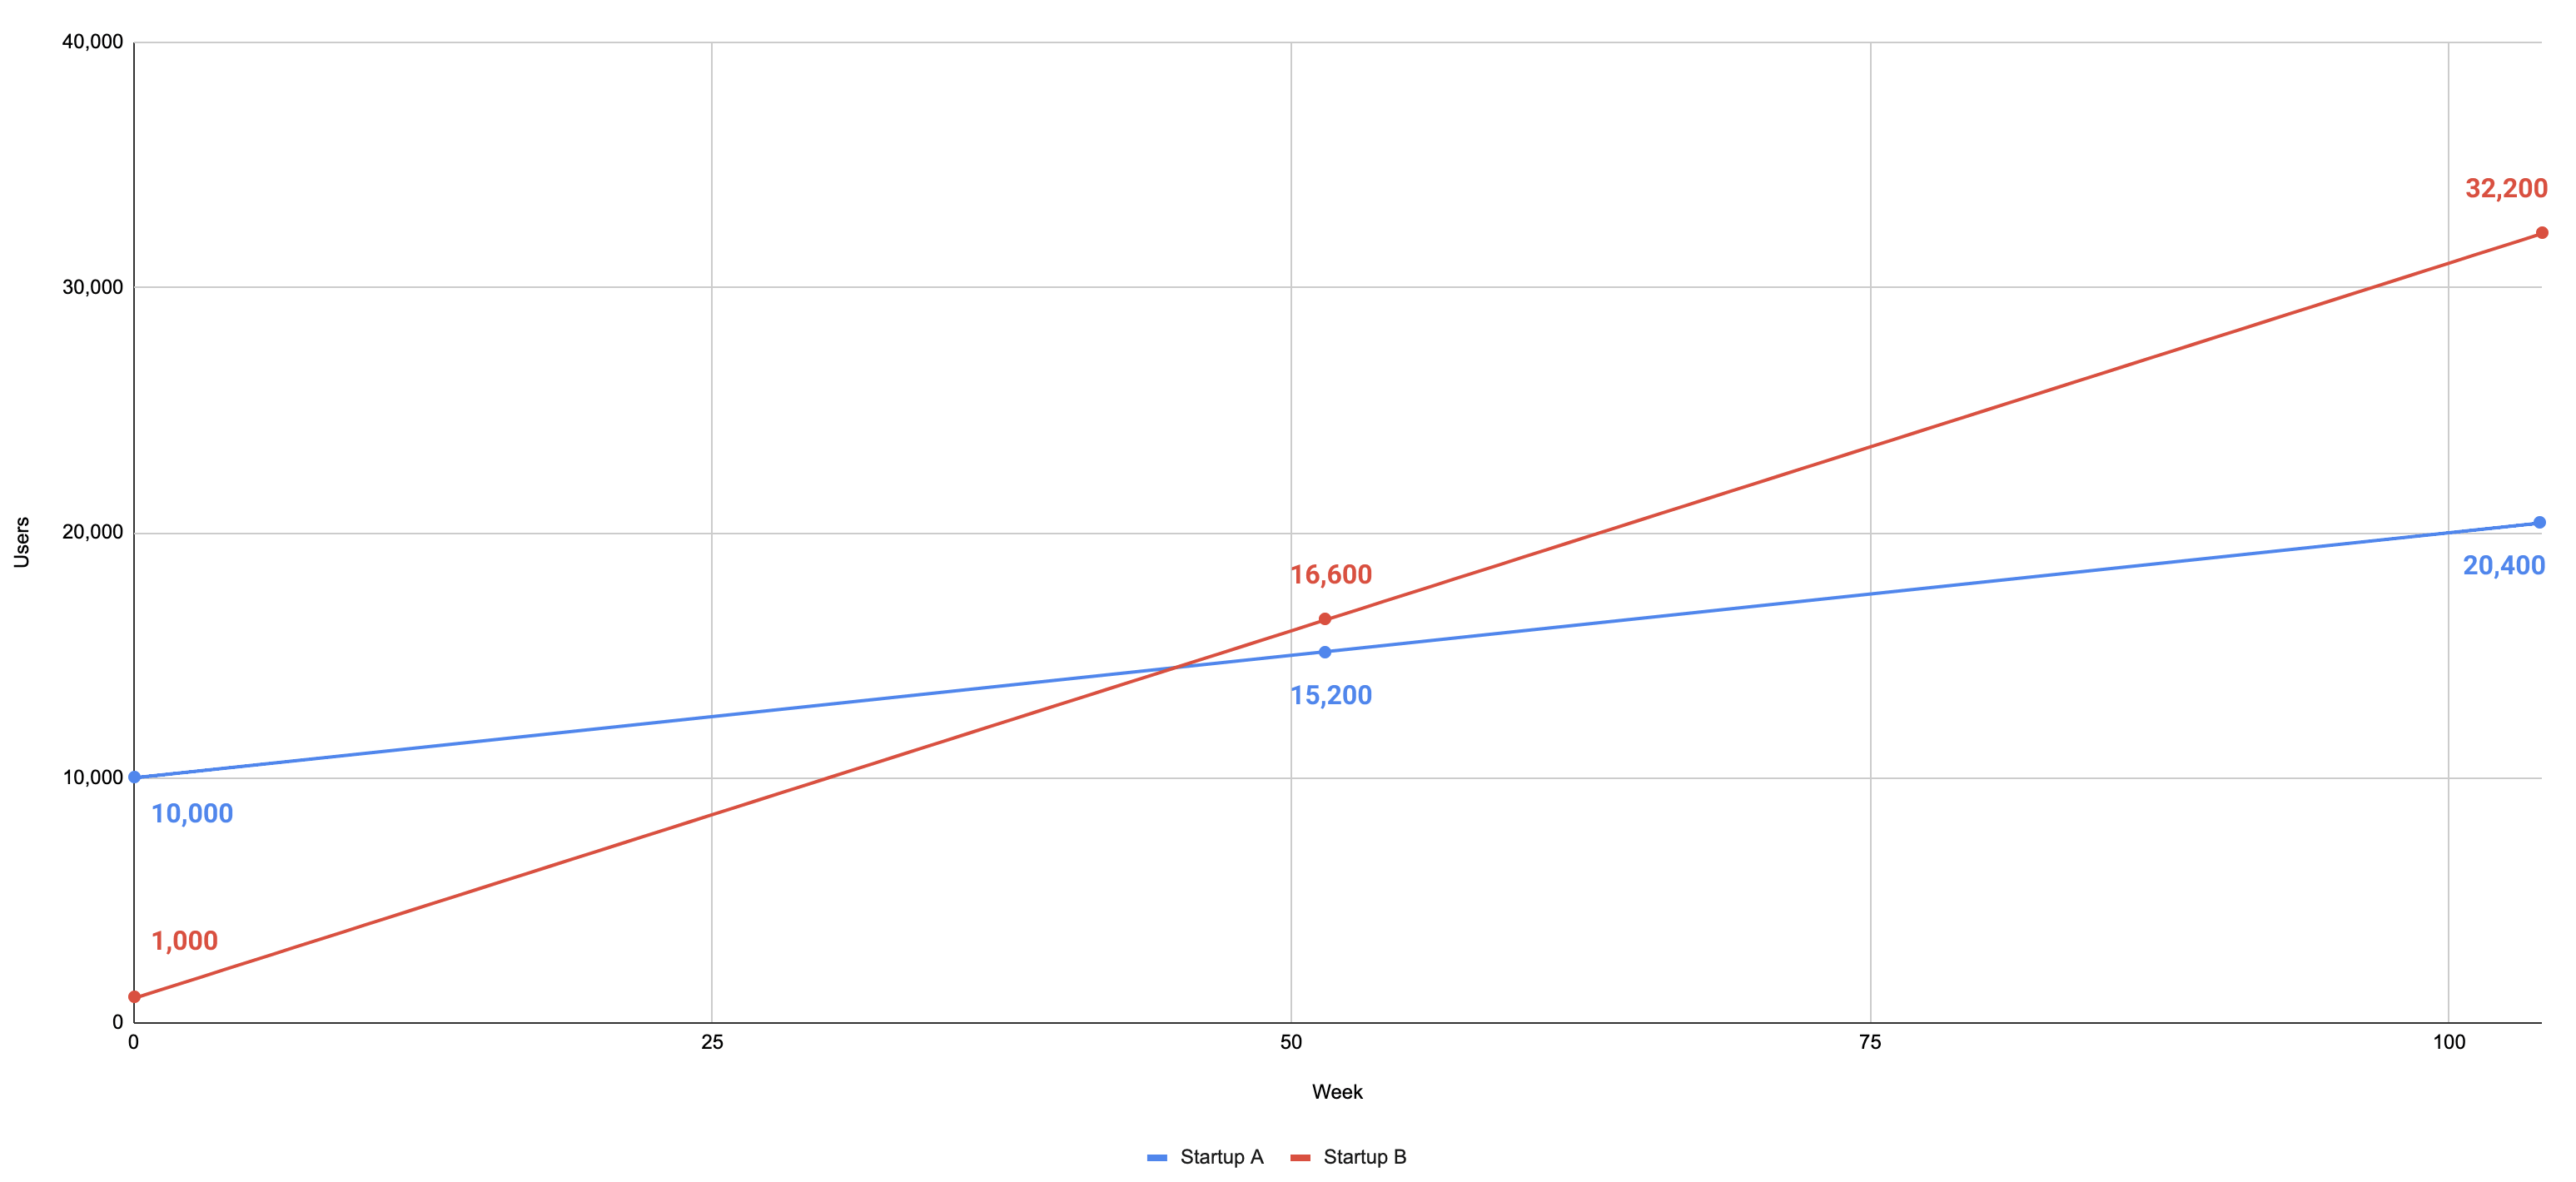
- Week 0 – Startup A is 100 times larger than Startup B
- Week 52 – Startup B surpasses Startup A in size
- Week 104 – Startup B is 1.57 times larger than Startup A
Note: There’s another type of startup we like even more. We’ll discuss them at the end.
Back to the question of estimating the slope of an early-stage startup. It’s a function of (1) the founders and (2) the market. Looking at it this way yields the following:
| Bad Founder | Good Founder | |
|---|---|---|
| GOOD MARKET | Small Slope | Large Slope |
| BAD MARKET | Negative Slope | Medium Slope |
Good founders in good markets are obviously good. Bad founders in bad markets are obviously bad. What isn’t obvious is whether good founders in bad markets or bad founders in good markets are better? I’d argue good founders, bad markets > bad founders, good markets because good founders can find their way into a better market[^This is more true for early stage companies, maybe less true for later stage companies.]. Better founders pulled into a good market will likely outcompete the bad ones. As an investor, you hopefully invest as much as you can in good founders in good markets, some good founders in bad markets, a very few bad founders in good markets, and no bad founders in bad markets.
Founders
If you take the above to be true, this yields an interesting result. There’s just one rule, invest in good founders.
How can you tell if the founders are good? In our experience, successful founders possess accurate mental models of how the world, as it relates to their business, works. Given a desired outcome (ie. 2x growth), they can run a simulation in their head, based on their mental model, and figure out what they need to do to produce it.
The secret is, no founders start this way. The world is too complicated. The difference between great founders and everyone else is how quickly they can update their existing model to be accurate. The best founders I know do this by (1) being deliberate and (2) iterating quickly.
By deliberate, I mean they have a clear articulation of their mental model, where it’s weak and a plan for improving those parts. To illustrate, let’s say someone was starting a ride-sharing company before they were ubiquitous. A version of the following would have been very impressive.
We believe 10x more people would use a taxi service 100x more often if (1) you could call them to you, (2) arrived in under 5 minutes and (3) was affordable. We believe (1) is a magical experience that’s significantly better than existing taxis. We’re the most worried about (3) and (2), in that order of priority. We’re going to test (3) by subsidizing the cost for riders to measure the elasticity of price on usage. After that, we will test (2) by increasing drivers bonuses in a specific location to increase driver density. By increasing driver density, we can drive down the wait time to under 5 minutes and study the residual impact on rider satisfaction and retention.
Let’s break this down. The first few sentences are a clear articulation of what they think will happen if they are successful and what 3 things they need to do to be successful. We can debate whether they are right but they have a clear position. They then go on to talk about which of the 3 things they are most worried about, and how they are going to figure them out.
By iterate fast, I mean they are updating their model daily or weekly, not monthly or quarterly. Remember that doubling your iteration speed is equivalent to being right twice as often. In our experience, it’s much easier to go from monthly to weekly iteration than it is to be right 4 times as often.
Said another way, consider the following 2 founders:
- Founder A – Runs experiments weekly and is right 10% of the time
- Founder B – Runs experiments monthly and is right 20% of the time
On average, Founder A will have their first success in 10 trials (1/.10) or 10 weeks. On average, Founder B will have their first success in only 5 trials but, since they run experiments monthly, that’s 5 months or 20 weeks. It pays to be fast.
Market
There are entire books written on what makes a market good and how to identify them but simplistically, I think about it along 2 axes: (1) how many people do you help? and (2) how much do you help each person? Thinking about it this way, yields the following:
| A little | A lot | |
|---|---|---|
| MANY PEOPLE | Good | Best |
| FEW PEOPLE | Bad | Great |
Products that help many people a lot are obviously great. Products that help a few people a little are obviously bad. You could argue that products that help a lot of people a little are better than products that help a few people a lot but in my experience the reverse is true. Practically, if you have a small number of people who care a lot about what you’re doing, it’s easier to build a product because you’re building for a narrow set of use cases and your customers are by definition more likely to give you feedback. It’s easier to monetize because they care a lot about it. It’s easier to find more people who care a lot about something than it is to get an existing group of people to care more about something.
Non-Linear
So far, the lines we’ve been talking about are called linear. In mathematics, there are also non-linear lines where the slope is not constant. They can increase and decrease as they go along. They are a little more complicated but a more accurate representation of a startup’s trajectory.
For example, say a startup announces a new round of funds and receives favorable press. Their slope will increase sharply for a short period of time but eventually revert to where it was originally.
The thing to remember about non-linear lines is they can grow significantly faster than linear lines. This is especially true if their rate of growth is accelerating[^For the really big math nerds, this is the slope of the slope or the derivative of the slope.]. Let’s take another look at the two startups we mentioned at the beginning and a third startup whose trajectory is non-linear and rate of growth is accelerating.
- Startup A has 1,000 users at Week 0 (y-intercept) and is adding 10 users every week (slope)
- Startup B has 10 users at Week 0 (y-intercept) and is adding 30 users every week (slope)
- Startup C has 10 users at Week 0 (y-intercept) and is growing 7% week over week (rate of change of slope)
Given these growth rates, here’s how big each of these startups will be in the coming years.
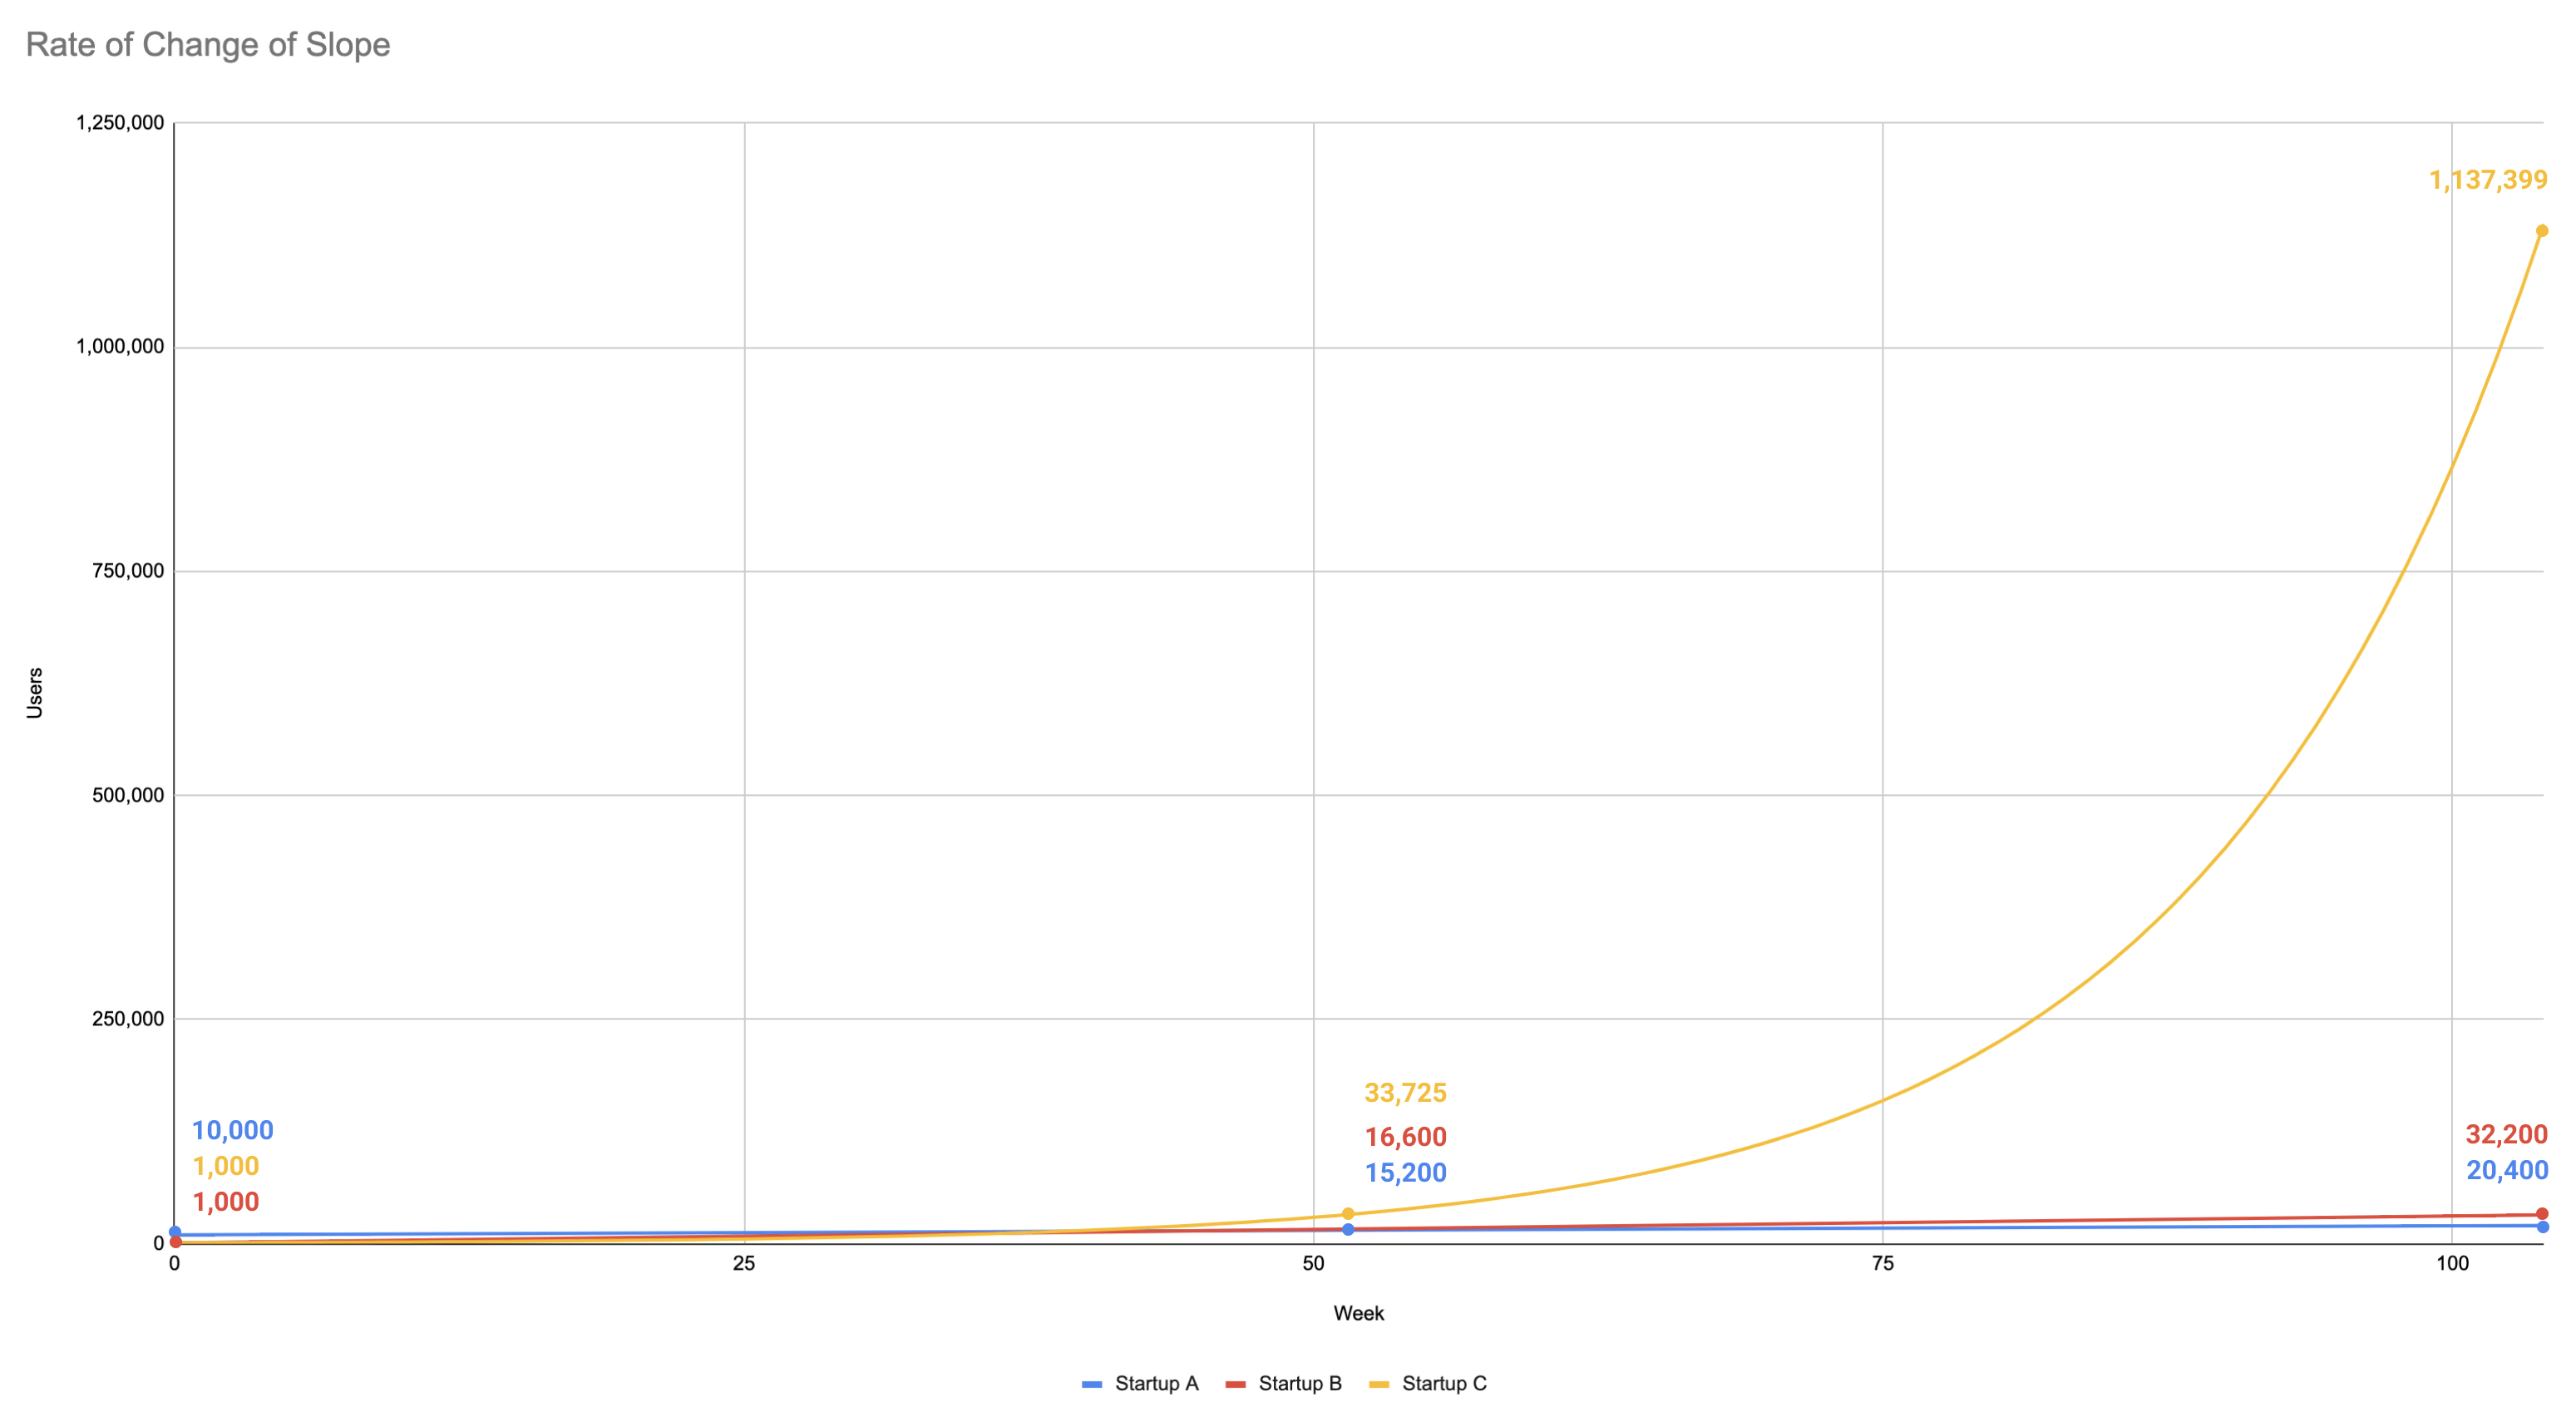
Startup C will be orders of magnitude larger than Startup A or Startup B. Remember, if you’re growing by the same number of users every week, your growth is actually slowing as a % of your user base (Startup A and Startup B). If you can maintain growth as a % of your user base, you’re growing exponentially (Startup C). That’s why success in our program is growing 5% to 7% weekly for the duration of the program. If they grow 7% for the duration of the program (12 weeks), they will be 2.25x larger. If they grow 7% for an entire year, they will be 33.7x larger.
Growing non-linearly is hard but not complicated[^This assumes you are sufficiently solving a real problem. Knowing whether you are or are not is a blog post all in itself.]. Think about your growth as the result of a set of growth initiatives. Every week, each of those initiatives will generate some amount of growth (users, revenue, etc.). When an initiative stops generating growth, you need to find another initiative to make up for the loss in production, otherwise your overall growth rate will decrease.
Given this, a good way to grow non-linearly is to work on growth initiatives that are (1) repeatable and (2) have low marginal cost. These types of initiatives generate growth each week with very little additional effort. That gives you time to work on other growth initiatives that will add to your overall growth. Content marketing and SEO are both examples of this but require significant effort before they reach this state. For some companies (B2B, D2C, some marketplaces), paid marketing might fit these criteria if you think of marginal cost as time instead of $ cost.
The best way to grow non-linearly is to work on growth initiatives that are (1) repeatable, (2) have low marginal cost and (3) compound. Initiatives that compound (ie. their growth generates more growth) generate an order of magnitude more growth than initiatives that don’t. These are rare, though. In my experience, they are either product specific or referrals. When people talk about viral products, what they’re really talking about are products with a high rate of referrals. Referrals are like growth recursion. Every referral has a chance to refer someone else and so on. The higher your rate of referrals, the more generations (and therefore users) are brought into your app.
In summary, if you’re an investor, invest in slope especially if it’s non-linear. If you’re a founder, work on generating non-linear growth. If you can, you’re probably onto something.
Thanks to Brian Ma, En Lerk Law, Marx Low, Yung Tyng Lee and Rachel Ng for reading drafts of this.